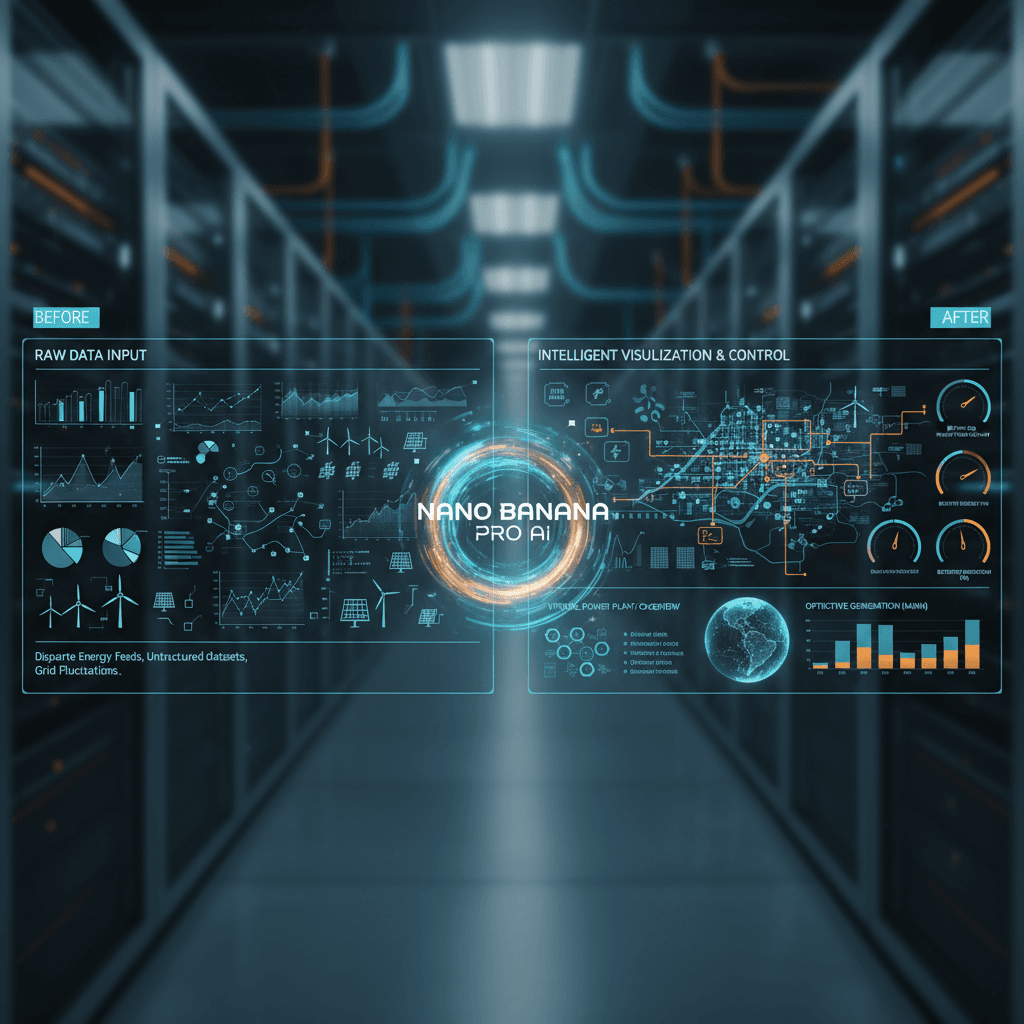
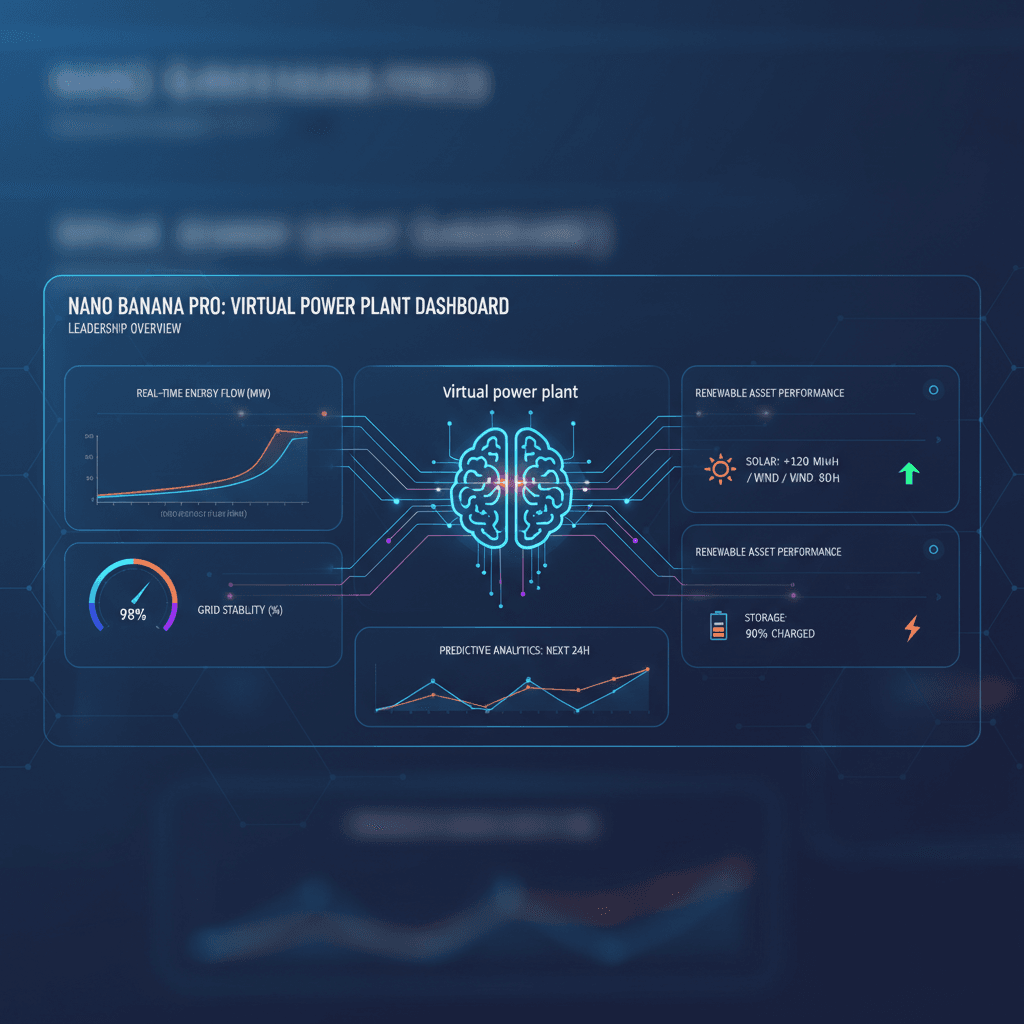
Data Dashboard (Energy)
完美的UI设计,不再为创意而烦恼!
A stunning ui design example created with Nano Banana Pro (Gemini Image Generation). Data Dashboard (Energy).
@bigscreen
AI 艺术创作者
实际效果展示
查看这个AI提示词创造的惊人效果
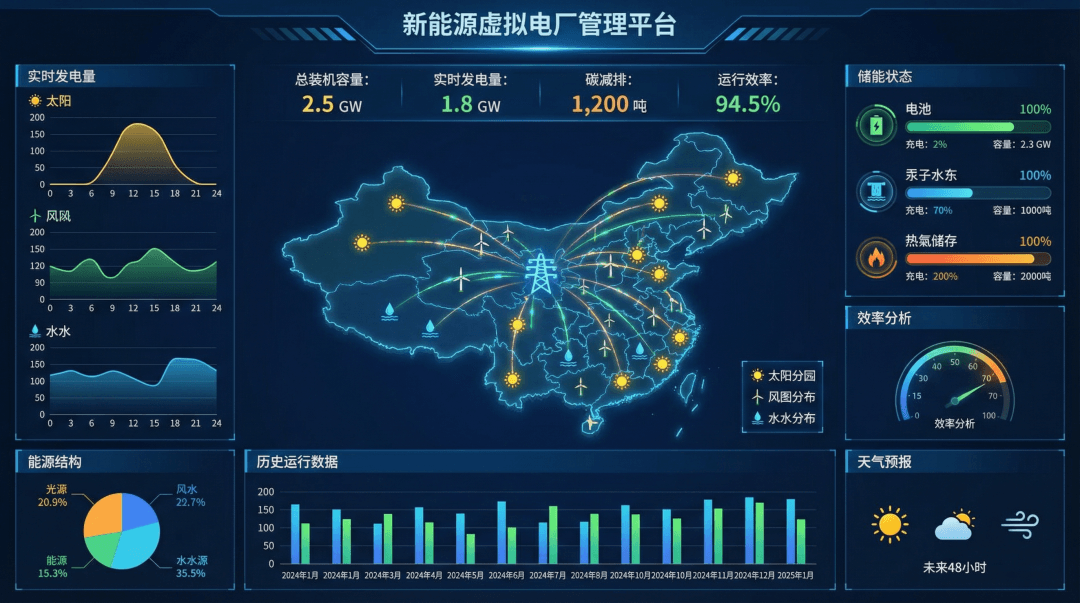
生成结果
完整提示词
复制下面的提示词,粘贴到您喜欢的AI工具中即可开始创作
帮我做一个新能源虚拟电厂的数据大屏,我要给领导展示的
为什么选择这个AI工具?
发现这个强大的AI提示词如何帮助您创作出令人惊艳的作品
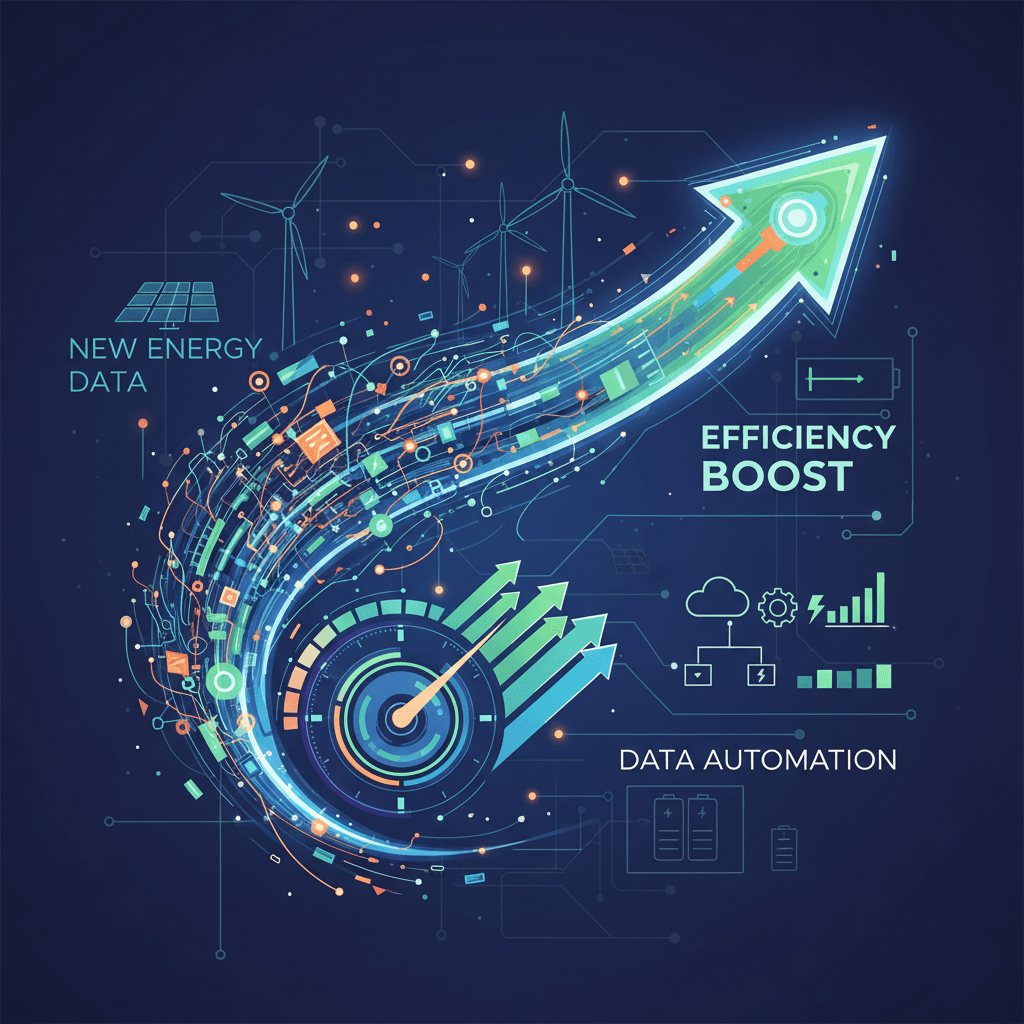
效率提升
The Data Dashboard (Energy) delivers an "Efficiency Boost" by streamlining data visualization for virtual power plants. With its stunning UI, powered by Nano Banana Pro, it enhances decision-making speed and clarity, enabling leaders to access critical insights at a glance, transforming data into actionable intelligence.
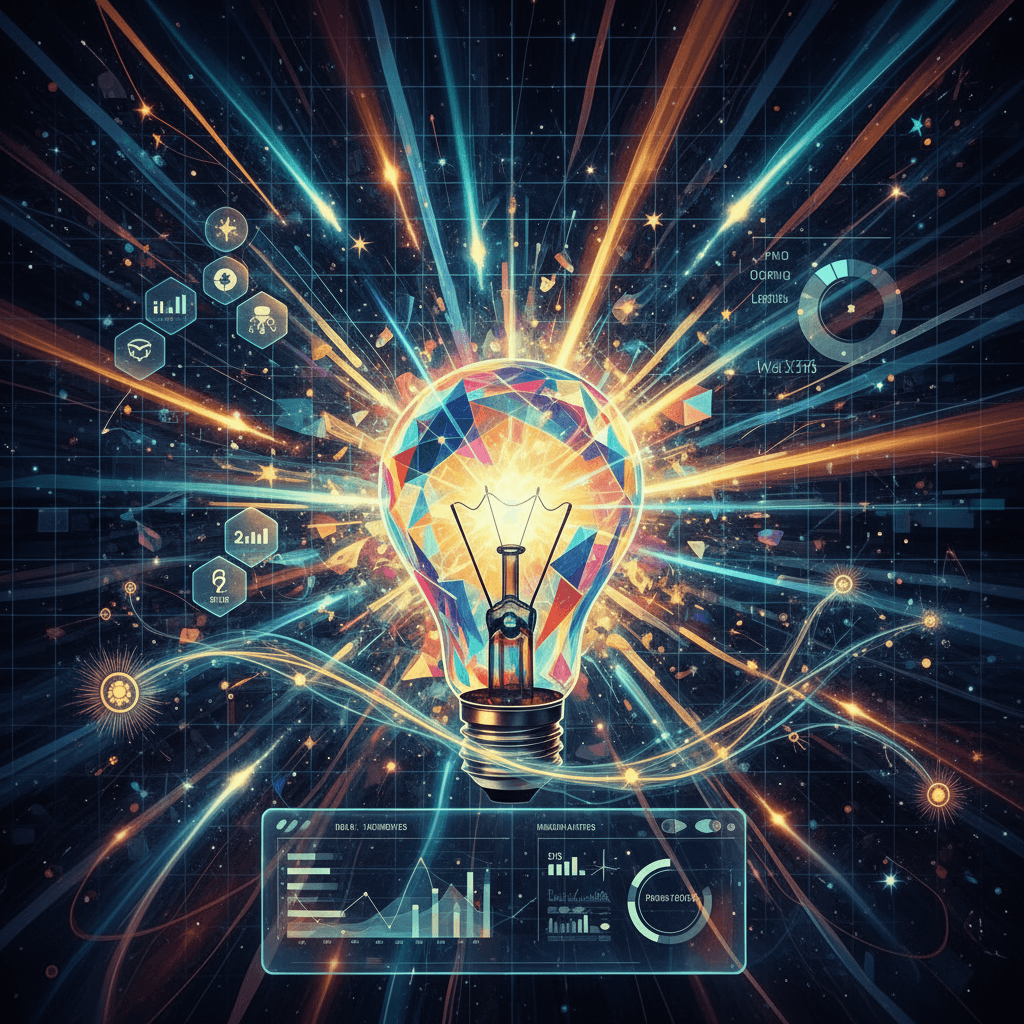
创意提升
The Data Dashboard (Energy) employs advanced AI-driven design capabilities to elevate "Creativity Enhancement" in visual presentations. By utilizing Nano Banana Pro's Gemini Image Generation, it fosters innovative data storytelling, transforming complex energy metrics into compelling visuals that captivate and inform stakeholders effectively.
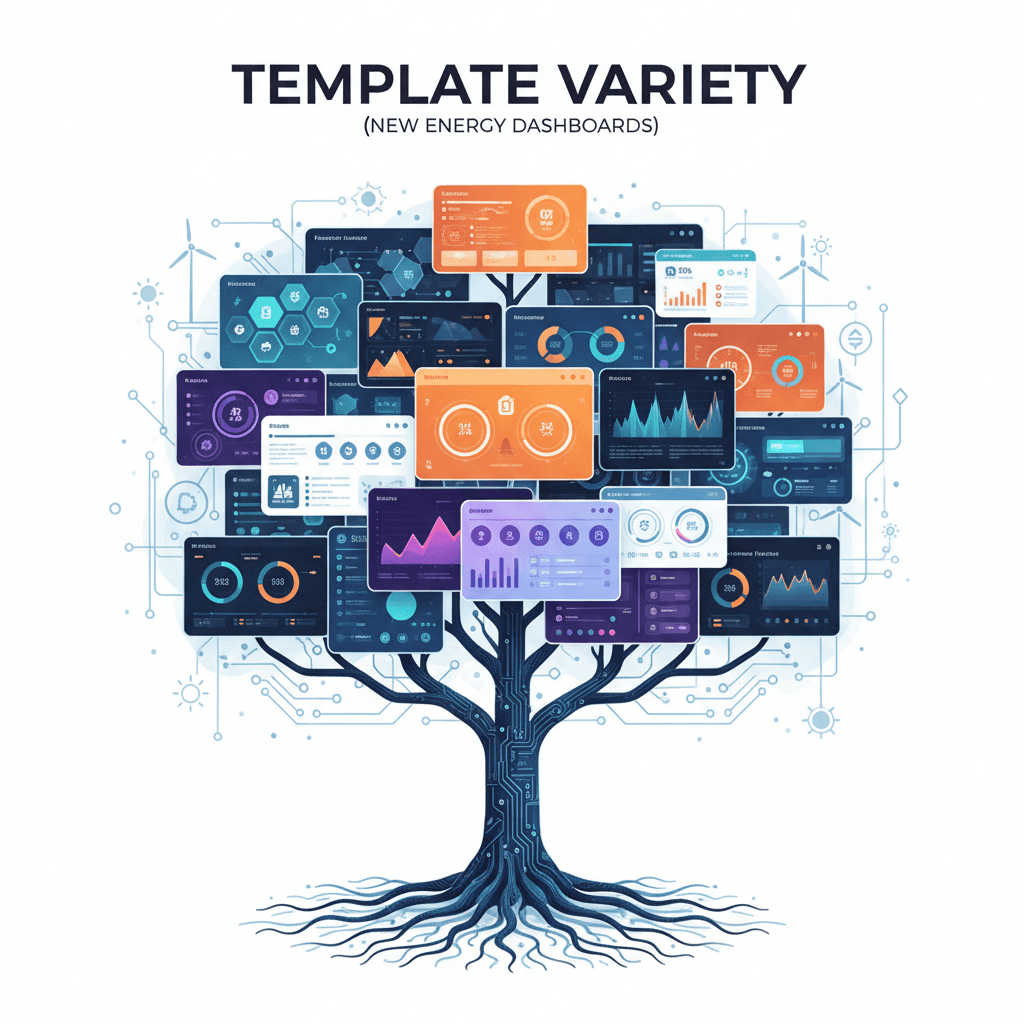
模板多样
The Data Dashboard (Energy) excels in "Template Variety," offering diverse design options tailored for virtual power presentation. This flexibility allows users to create visually engaging displays, enhancing data storytelling and executive insights. Leverage AI-driven customization for impactful communication in the energy sector.
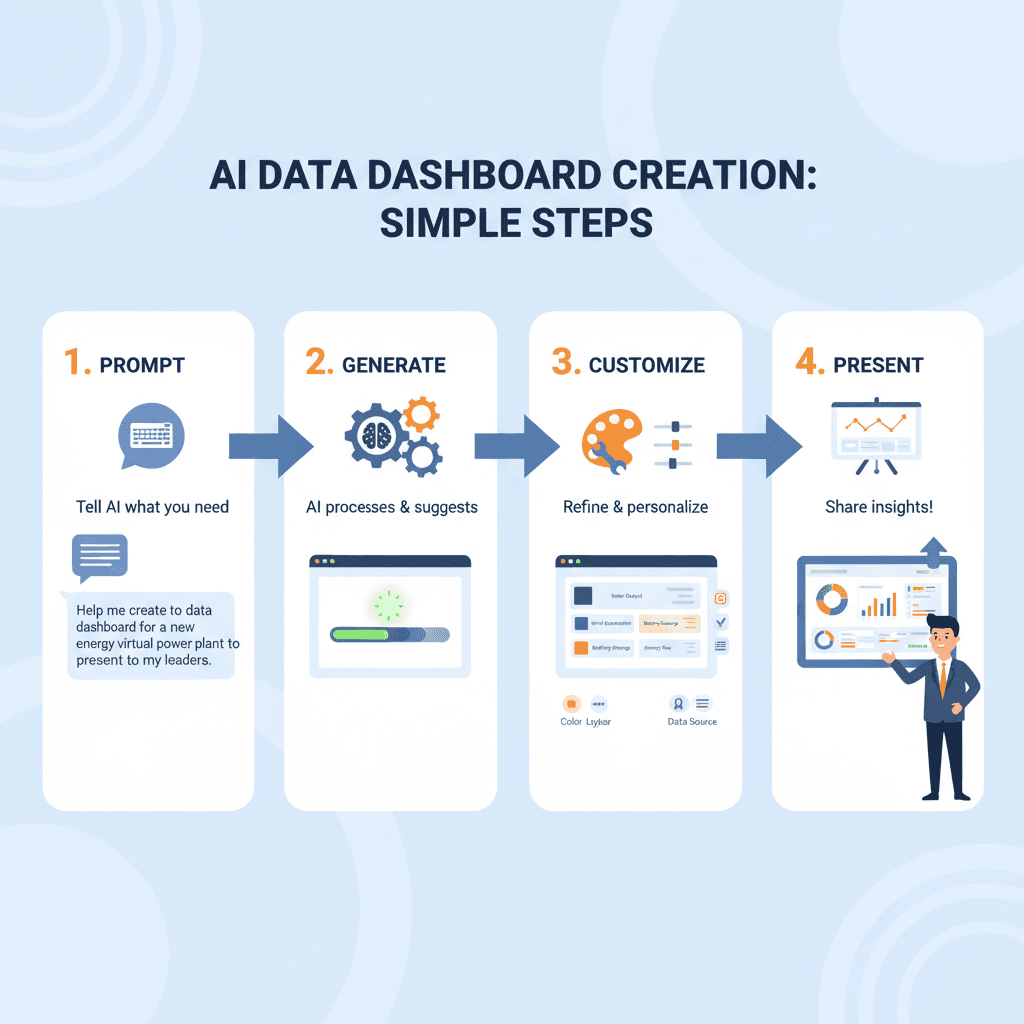
如何使用UI设计AI工具?
只需几个简单步骤,即可创建令人惊艳的AI艺术作品
- 1
输入想法
To input your ideas, type a brief description of your desired energy data dashboard in the provided text box, focusing on key metrics and visuals you want to present to your leaders.
- 2
选择模板
To select a template in Data Dashboard (Energy), click on the “Templates” tab, browse through the options, and choose a design that suits your presentation needs.
- 3
AI生成
To generate your energy data dashboard, enter the core technical prompt into the input field: “帮我做一个新能源虚拟电厂的数据大屏,我要给领导展示的” and click "Generate."
- 4
下载作品
To download your artwork, click the "Download" button on the Data Dashboard (Energy) interface. The generated image will be saved to your device for easy access and presentation.
谁可以使用这个AI工具?
这个AI工具适合各种创意专业人士和爱好者
Energy Analysts
Energy analysts can use the Data Dashboard to visually represent renewable energy data, enabling them to easily spot trends and present findings in a compelling way to stakeholders.
Corporate Executives
Corporate executives can leverage the dashboard to assess the performance of virtual power plants, making strategic decisions based on clear, visually engaging data during high-level meetings.
Renewable Energy Consultants
Consultants can utilize the tool to create impactful presentations for clients, showcasing energy efficiency metrics in an easily digestible format, helping clients understand potential improvements.
用户怎么说
看看用户对这个AI工具的真实评价
Jake
Freelance UI Designer
“I've been using the Data Dashboard (Energy) tool for about three months now, and it's a game changer for my projects. The stunning UI design really impresses my clients, and I've noticed a significant drop in the time I spend on visual presentation. Just last week, I was able to create a complete dashboard layout in under two hours, which usually takes me a whole day. The intuitive interface helps me focus on design rather than fiddling with complex settings.”
Emily
Small Business Owner
“As a small business owner, I've tried various tools to visualize my energy usage data, but Data Dashboard (Energy) is by far the best. I've been using it for about a month, and the clarity of the designs has helped me communicate important insights to my team quickly. One feature I love is how easy it is to customize graphs and charts; I saved at least three hours last week preparing for a presentation. It's a relief to have something so effective and visually appealing.”
创作亮点
Transform your energy data presentation with our AI generation tool! Experience a remarkable UI design for your virtual power plant's dashboard, crafted using Nano Banana Pro. Perfect for showcasing intelligent insights and automated analytics to your leadership team. Elevate your ui_design and drive efficiency today!
常见问题
解答您在使用AI工具时可能遇到的问题
准备开始您的AI创作之旅了吗?
使用这个经过验证的AI提示词模板,几分钟内创建专业级的艺术作品。立即开始体验不同寻常的AI创作乐趣!
发现更多AI工具
探索我们精选的AI创作工具集合
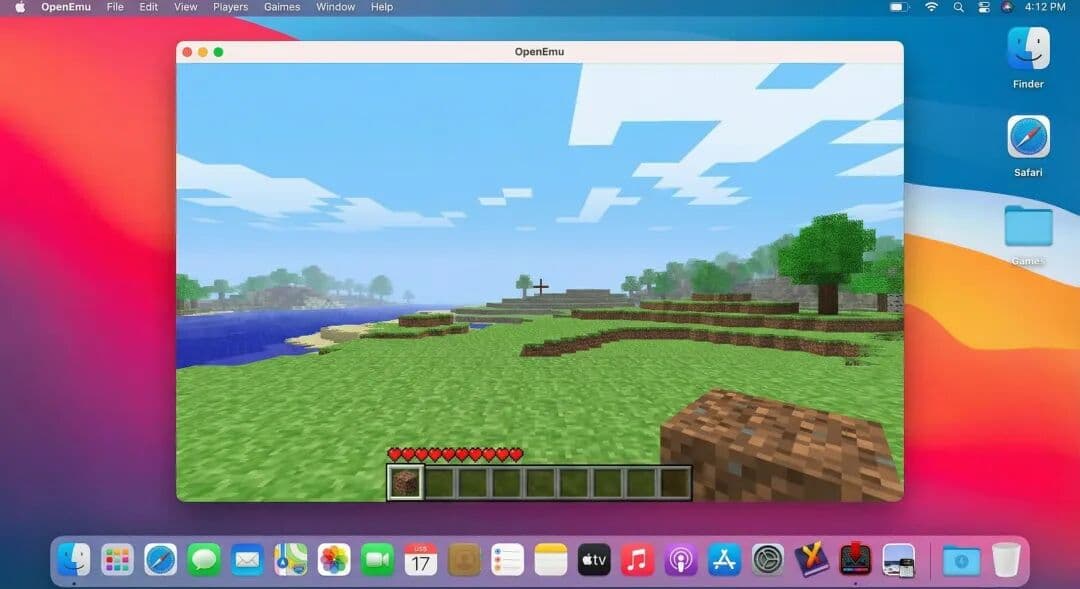
Game Emulator Interface
A stunning ui design example created with Nano Banana Pro (Gemini Image Generation). Game Emulator Interface.
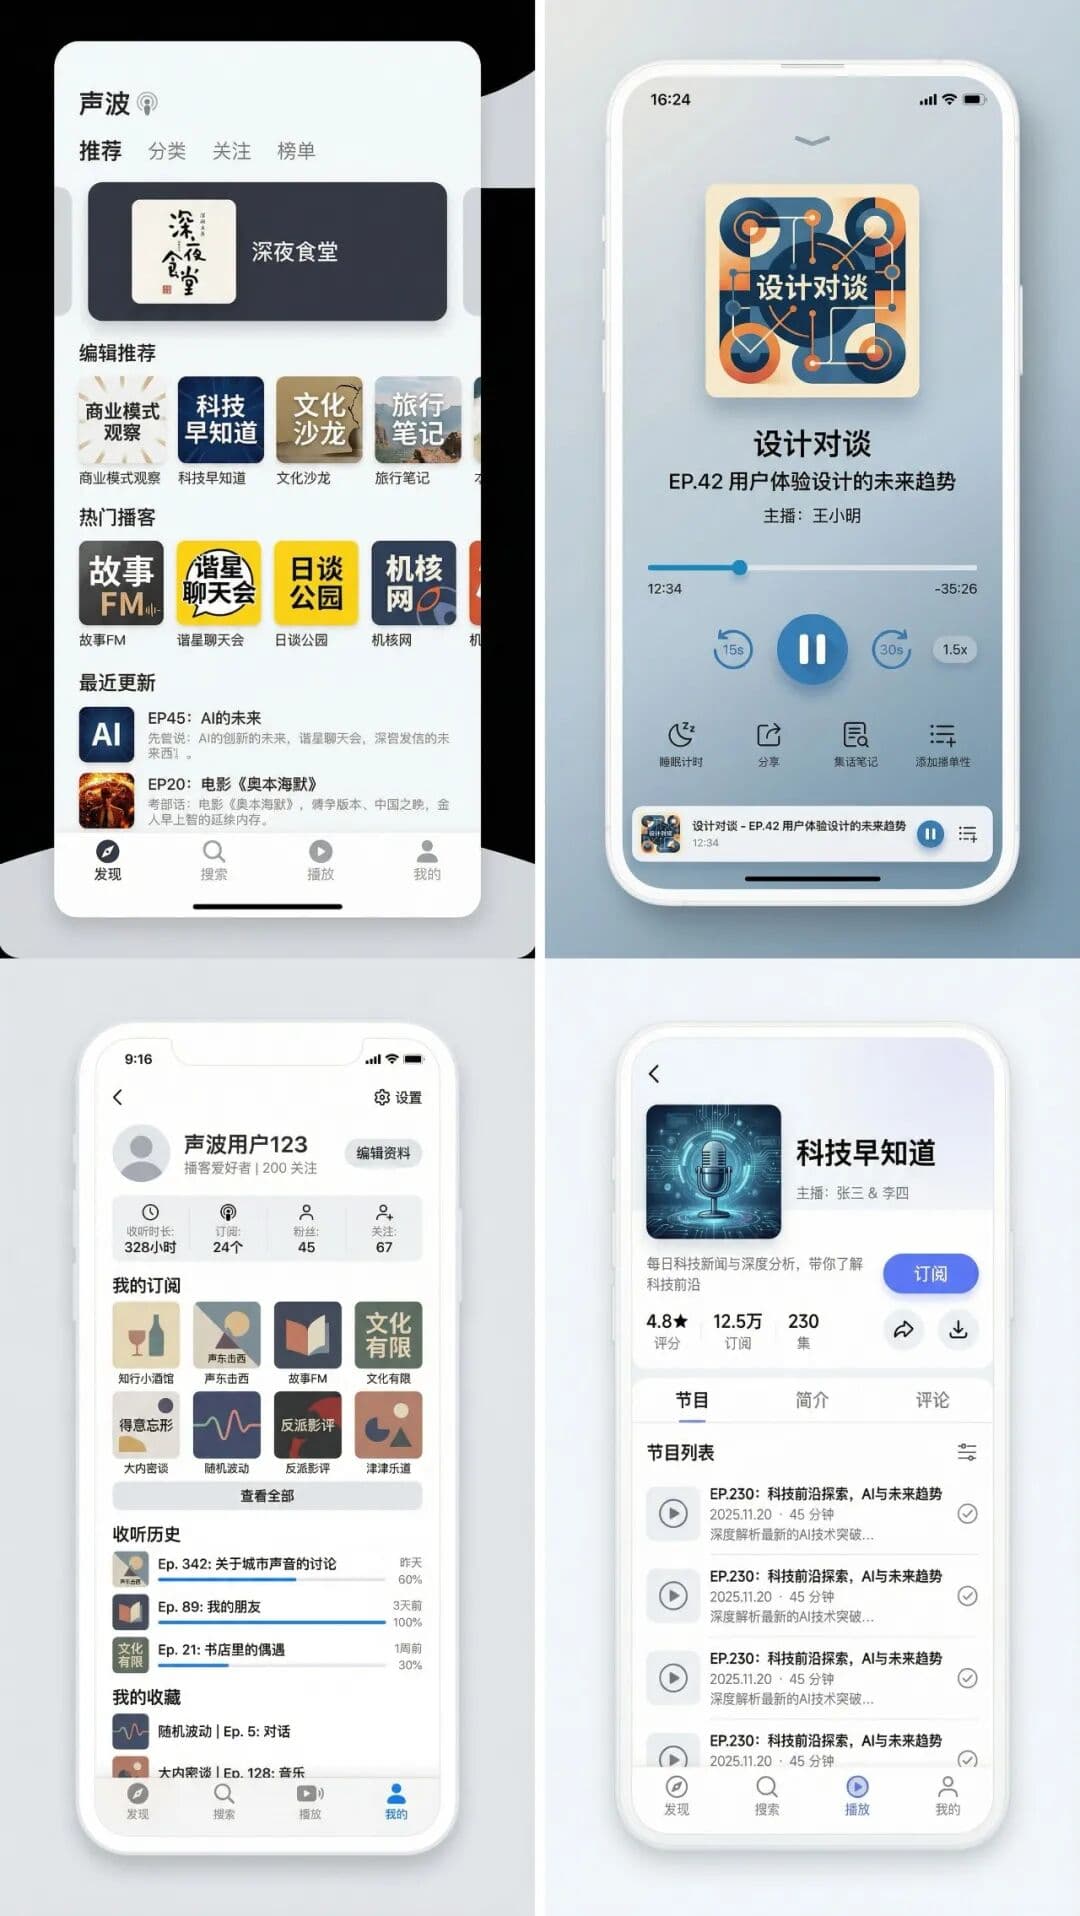
App Prototype Design
A stunning ui design example created with Nano Banana Pro (Gemini Image Generation). App Prototype Design.
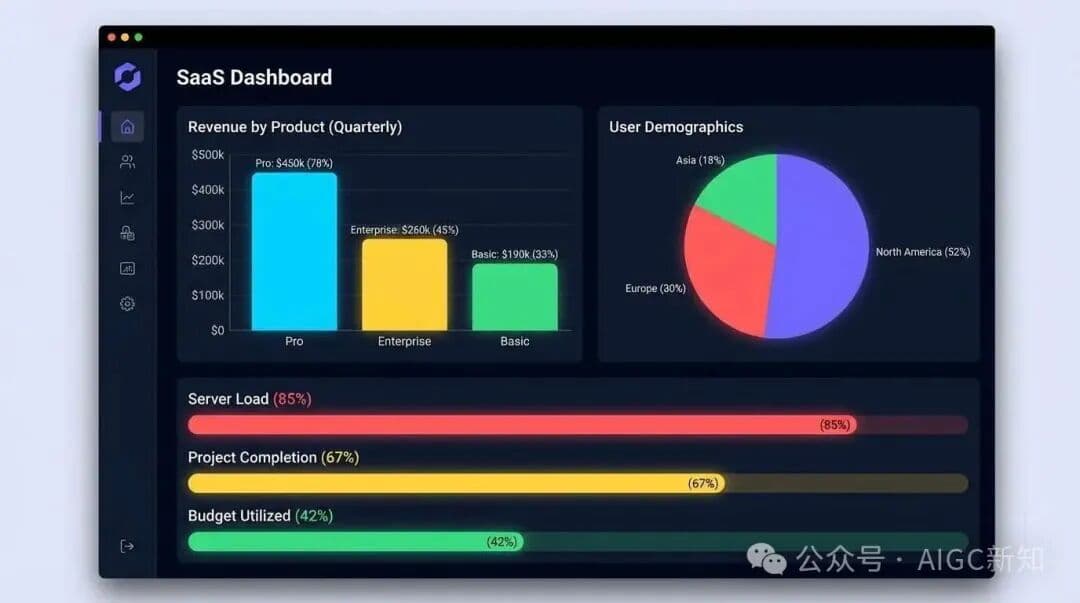
SaaS Dashboard Design
A stunning ui design example created with Nano Banana Pro (Gemini Image Generation). SaaS Dashboard Design.
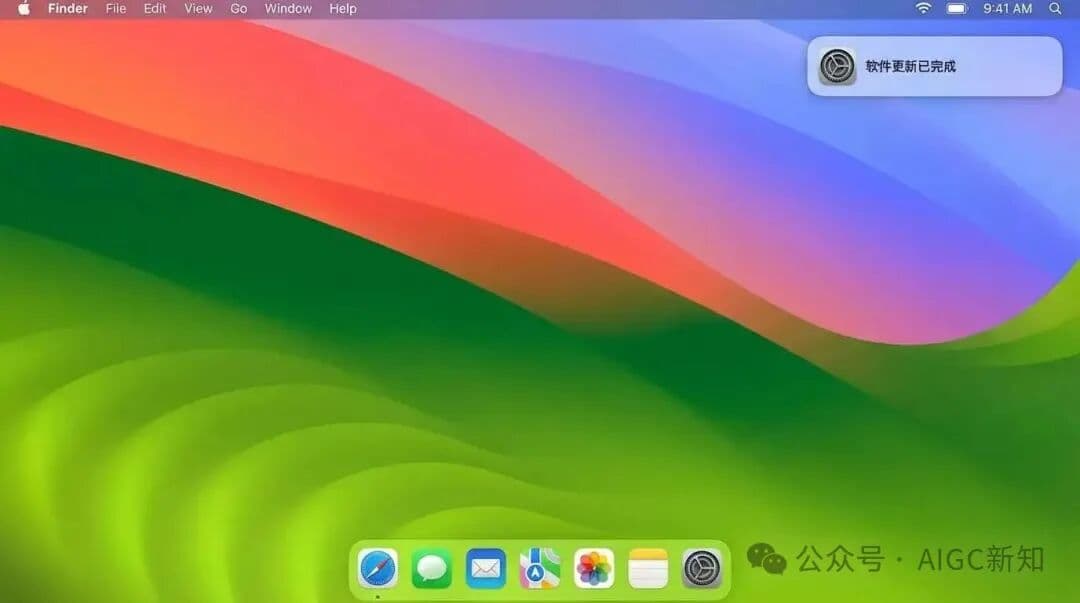
macOS Latest Recreation
A stunning ui design example created with Nano Banana Pro (Gemini Image Generation). macOS Latest Recreation.
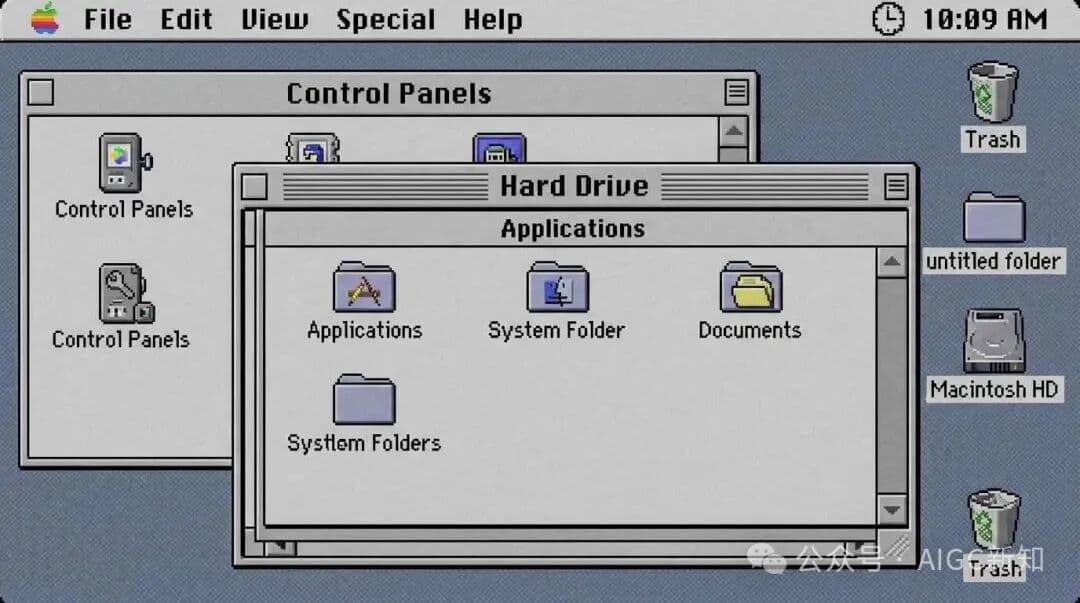
Mac OS 9 Recreation
A stunning ui design example created with Nano Banana Pro (Gemini Image Generation). Mac OS 9 Recreation.
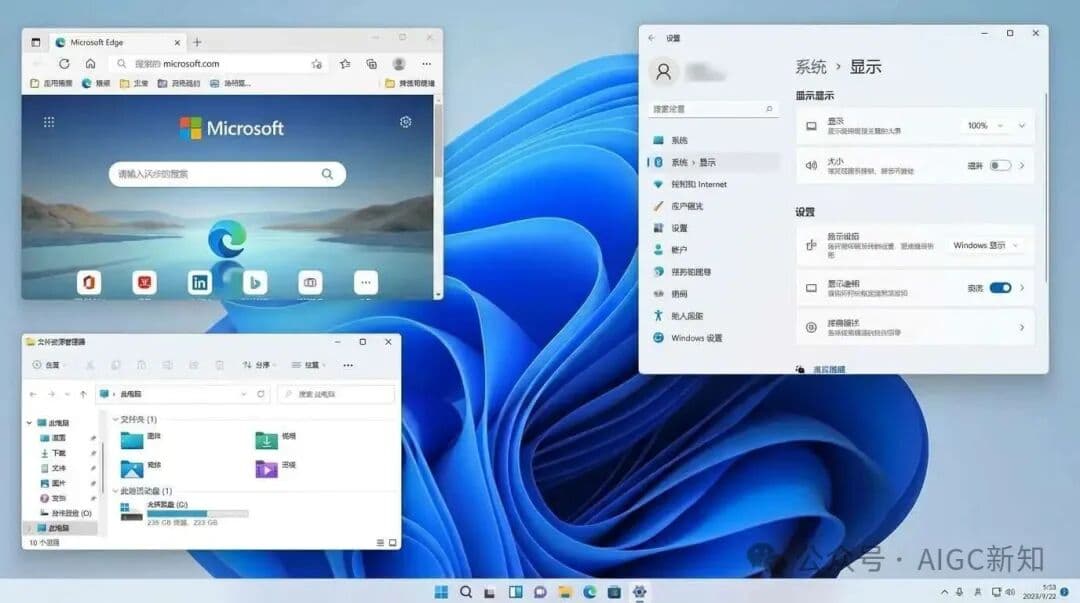
Windows 11 Recreation
A stunning ui design example created with Nano Banana Pro (Gemini Image Generation). Windows 11 Recreation.